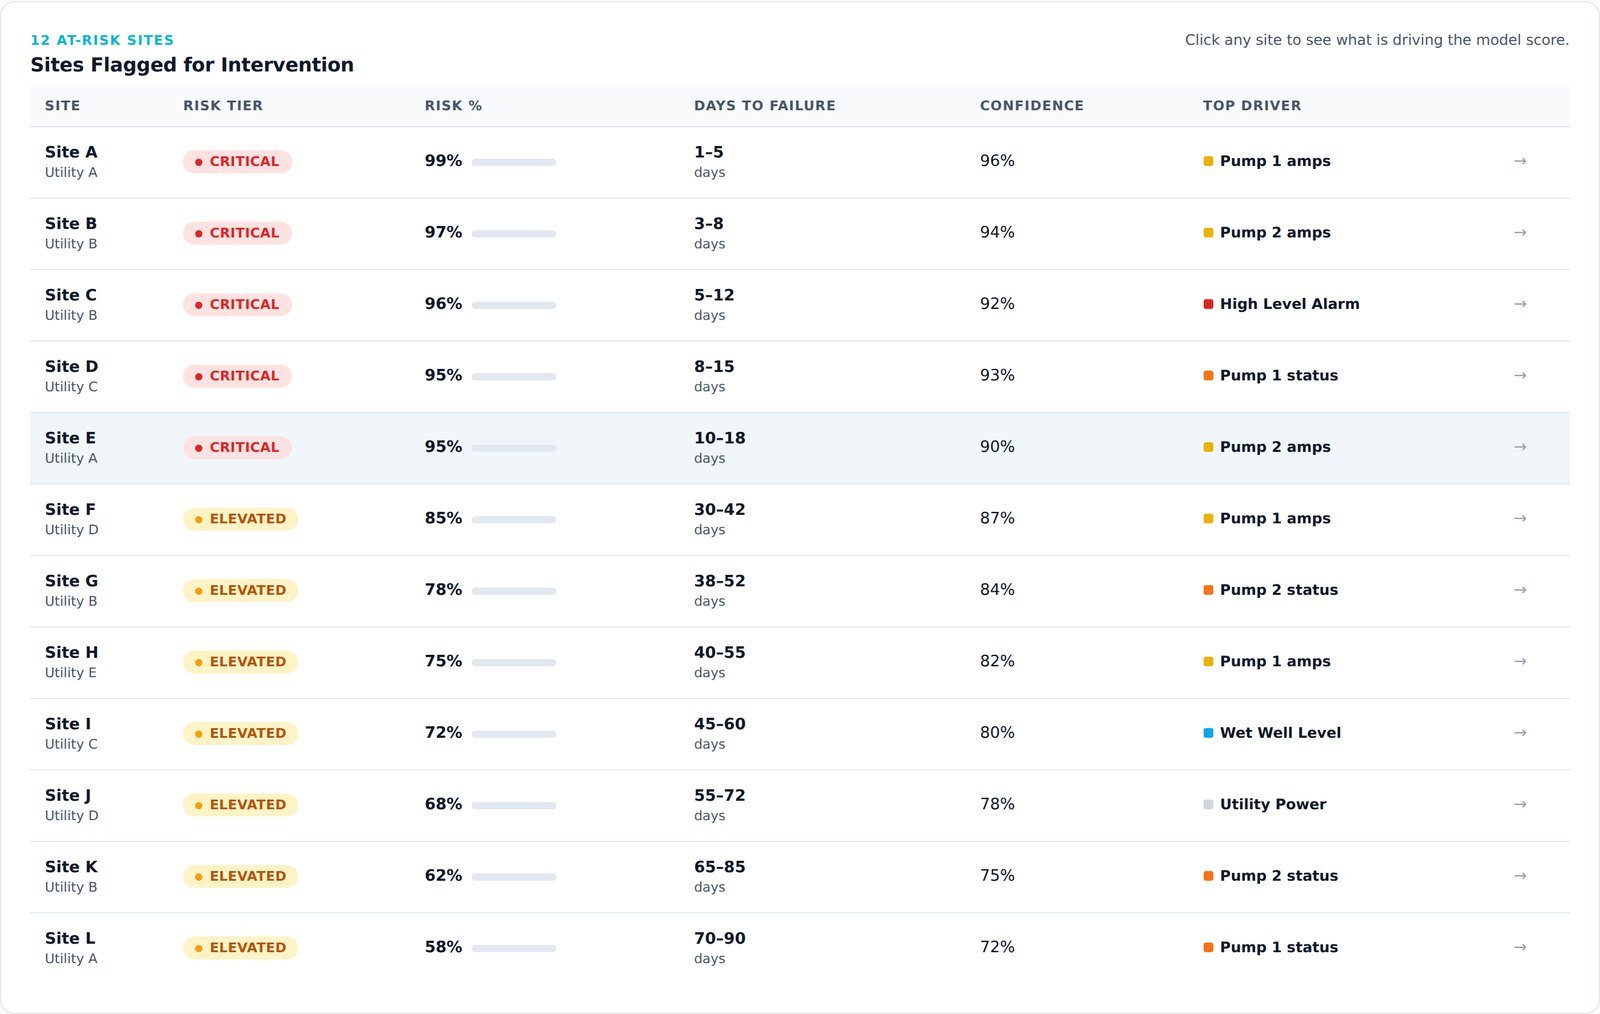
PRISM learns the normal signature of every pump, well, plant and lift station from the SCADA you already collect, then flags the ones drifting toward failure with months to plan the work.
The ranked list as an operator sees it. Site and utility names anonymized.



Not a health score to interpret. Every monitored asset laid out against the clock, so the work sorts itself.
Each bar is one asset's predicted days-to-failure window. Where it sits is when to act. How dark it is is how certain and how severe. Sorted soonest first, so a planner works top to bottom.
By the time the high-wet-well alarm sounds, the pump is down and the call-out clock is running. The drift that led there was readable for months.
Stations throw constant alarms on conditions that are normal for that site. Operators tune them out, then get surprised by the failure buried in the noise.
A failed pump pulls in call-outs, overtime, bypass pumping, cascade damage, boil-water notices and clearance sampling. The same fix in daylight costs a fraction.
A regional extract from the reference deployment: every failure in the window, tested against the model running the whole time. Twenty-six were flagged. Two produced no crossing at all and earn credit nowhere.
Expect the work-order count to rise, not fall. Acting on a warning means touching assets that had not yet failed, so total maintenance events go up while emergency events go down. The measure that holds up is emergency and after-hours labour hours against the same interval a year earlier.
An eight-week validation on a lift-station network, run with the same operator. The parts get bought either way. What advance notice recovers is the emergency premium, the cascade damage, the overflow and the overtime.
| Station | Spent | Avoided |
|---|---|---|
| Transfer station, worn marine hose | $225 | $29,740 |
| Residential station, pump overload | $1,474 | $28,491 |
| Subdivision station, both pumps clogging | $2,981 | $26,984 |
| Residential station, greased-over floats | $28 | $3,992 |
| All nine interventions | $8,749 | $138,101 |
The reference number is $1,616 of realized savings per monitored asset per year, reconciled against an operator's own cost records. It was earned at an intervention rate of 83.6%, the share of flagged failures actually acted on. That one number moves the answer more than anything else, so it is a control you set.
Your real figure comes out of your own telemetry during an evaluation, not this slider.
A first-order projection scaled from the validated deployment.
Basis. $1,616 per monitored asset per year at an 83.6% intervention rate, scaled linearly. Event frequency from 28 failures across 391 assets in a 228-day window, annualized. System-class weighting is modeled. Excludes asset-life extension, capital deferral, energy and regulatory upside.
PRISM reads the SCADA and historian telemetry your utility already collects, under a read-only credential, and delivers the decision into the system your crews already open every morning.
One-directional ingest in, decisions out. Nothing in the product can change a setpoint, close a valve or start a machine.
No. PRISM is software only. It reads the telemetry you already collect, so there is nothing to install in the field and no capital cost to deploy. The reference deployment covers 391 assets with zero field hardware, and we were never on site.
Because the output is a ranked daily list with reasoning attached, not another feed, and every flag is triaged before it reaches a person. We also tune sensitivity against your cost of intervention per asset class: for remote stations where a truck roll is expensive the model stays quiet unless it is confident; for plants where a crew is on site and a miss is a compliance event it surfaces the marginal case.
No, and you should expect the opposite. Acting on a warning means touching assets that had not yet failed, so total maintenance events rise while emergency events fall. If your pilot review counts work orders it will read as a failure. Measure emergency and after-hours labour hours against the same interval in the prior year.
A short scoping call, a model built on your telemetry in four to eight weeks, and a review of the predictions against your real failure history. Evaluation is at no cost, with no exclusivity and no obligation. Deployment requires essentially zero engineering hours from your team.
We build a model on your telemetry, then review the predictions against your real failure history, event by event.
No cost to evaluate. No live connection required. No obligation.