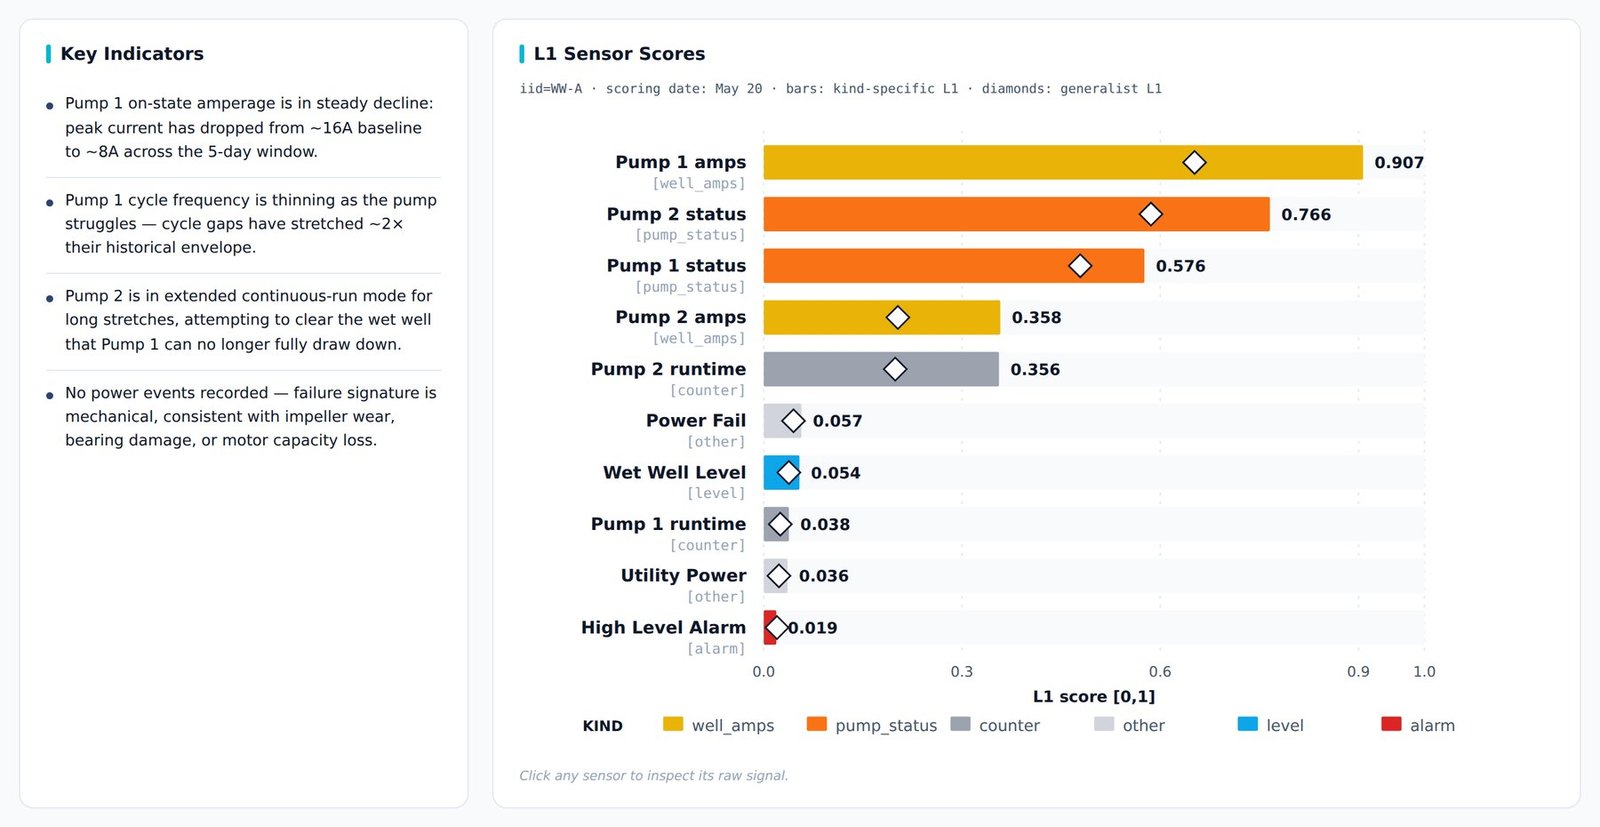
The physics of early warning does not depend on the medium. PRISM reads water, coolant and current the same way, because every continuous flow carries a signature, and that signature shifts before the system fails.

One prediction as the operator sees it. Asset, failure mode, days remaining, and what to do about it. Site names anonymized.
A threshold watches one channel and fires when it crosses a line. By then the failure has already happened. The information that would have warned you was in the relationship between channels, months earlier, and no single line can see it.
Pressure is fine. Current is fine. Temperature is fine. The three of them moving together in a way they never have before is the signal, and a threshold cannot represent it.
When efficiency fades, the controller compensates to hold the same output. The result looks healthy for months. The effort spent to hold it does not.
Some failure modes develop faster than the interval between the checks assigned to catch them. A schedule followed perfectly still leaves the asset uncovered for most of the interval.
PRISM came out of clinical prediction work, turning a medical record into a scientific instrument. The techniques that let you see a patient decline turned out to read a pumping station just as well.
A healthy system holds a steady state under changing load. So does a healthy patient. Failure is the loss of that regulation, and it shows up well before any single reading goes out of range.
Telemetry is projected into a high-dimensional space, the way a language model embeds words. Once an asset's behavior is a position in that space, you can do arithmetic on it: fit it, compare it, and see the jump across many dimensions at once that a single channel would never show.
The first layer evaluates each sensor on its own. The second combines them into a verdict for the asset. That second layer is why a struggling lead pump with a healthy standby behind it does not become an alarm.
One-directional ingest in, decisions out. Nothing in the product can change a setpoint, close a valve or start a machine.
Most predictive tools assume a tidy, continuous, well-labeled feed. Industrial telemetry is none of those things, and the gap between the demo and the deployment is where those tools die.
A remote station drops off the network for a week, then transmits a week of readings in two minutes. A tag is named for the contractor who installed it in 2009. Half the assets have no failure history at all. A sensor was replaced and nobody wrote it down.
The same character shows up in medicine, where a patient disappears for a year and returns mid-illness, and you have to pick the story up in the middle. The models were developed against that problem first. Handling it here is not a workaround. It is the design.
As heat transfer or hydraulic efficiency fades, the control system compensates by raising flow or speed to hold the same result. Output looks healthy for months. PRISM watches the compensation, which is where the decline actually shows.
A prediction engine that ignores what it costs you to respond will be wrong in the expensive direction. We set the balance per deployment, per asset class, with you at scoping.
A remote station four hours from the depot. A truck should never roll for an asset that does not need work, so the model is set so that when it speaks, it is right.
A plant with a crew already on site, where the consequence of a miss is a compliance event rather than a truck roll. Here nothing should be missed, so the marginal case gets surfaced.
Written for the person who already has the wrench. A health index of 0.62 tells a maintenance planner nothing they can schedule against.
Format shown from a production water deployment. Data center and process-plant output carries the same fields against the relevant asset class.
This is the view a maintenance planner opens. Not a health score to interpret, but every monitored asset laid out against the clock, so the work sorts itself.
Each bar is one asset's predicted days-to-failure window. Where it sits is when to act. How dark it is is how certain and how severe. Sorted soonest first, so a planner works top to bottom.
Maintenance runs on fixed intervals. Some failure modes develop faster than the interval assigned to catch them, so the asset sits uncovered for most of the cycle no matter how diligently the work is done. We show you which ones, with the numbers.
For each asset, we list every failure mode it is known to have, then show how each one is covered today: by live telemetry, by a scheduled task, or not at all.
How often the task runs, against how fast the failure actually develops. A partial discharge test on a three-year cycle cannot catch a fault that matures in two months, and we show the arithmetic.
Where live data covers a mode, we produce the written evidence your maintenance program needs on file before a task comes off the calendar.
Not every task should go, and we will say so. A protection relay only reveals its condition when you operate it, so a quarterly functional test earns its place. The tasks worth questioning are the ones assigned to catch a fault that outruns them.
The standard has already moved. The 2026 edition of NFPA 70B, the US standard for electrical equipment maintenance, allows condition data to set maintenance intervals in place of a fixed calendar, and accepts continuous monitoring in place of some manual inspections.1 Adoption is still low. That gap is the opportunity.
Everything marked live is running in production against a paying customer's assets. We will tell you the same thing on a call.
Per-asset drift caught across correlated telemetry channels, before any threshold is crossed.
The probable fault named from the shape of the deviation, not just an anomaly score.
A window in days, ranked across the fleet, that a planner can schedule against.
The sensor pattern and the likely fault, written for the crew rather than the data team.
The recommended fix, parts lead time, and the cost multiple of deferring it.
Severity-routed into the CMMS, EAM, dispatch queue and phones your team already uses.
Set by asset class against your real cost of intervention.
Including sensor classification and calibration for site-specific naming conventions.
Including free-text maintenance notes, cleaned on our side rather than yours.
So the return becomes measured rather than modeled, in a monthly one-page summary.
Chillers, cooling towers, CRAHs, chilled and condenser water pumps, CDUs and coolant loops.
UPS strings, switchgear and distribution, read from existing EPMS and DCIM telemetry.
Prediction delivered through a pump and SCADA manufacturer's installed base, at fleet scale.
Expansion of the reference deployment beyond the original station set.
Every documented mode for an asset class classified by how it is covered today: existing telemetry, added sensor, truck roll, outage, or nothing.
Each scheduled task tested against how fast the failure it is assigned to catch actually develops.
Where failure cost includes regulatory penalty and interruption commitments, not only repair.
This alarm, plus that alarm, plus this temperature rise, means one thing. Today that inference lives in the head of whoever is on shift.
If one equipment model is failing faster than the rest under similar load, you will know. Sharper with every site added.
The documented justification a maintenance program needs on file before a calendar interval is extended.
Closing the loop from dispatch back to outcome automatically, and carrying asset health into capital planning.
Midstream and pipeline pumping, mining dewatering, chemical and pharmaceutical process plant.
Live means running in production on a customer's assets today. Deploying means the models are built and evaluations or rollouts are underway. Validating means the approach is designed and being proven out before we ship it. Where the method goes next
| Layer | Systems | Typical interface | Direction |
|---|---|---|---|
| Water & wastewater | SCADA, RTUs and pump controllers, historian, district metering | Historian export or API, Modbus over the existing gateway | Read only |
| Data center cooling | Chillers, cooling towers, CRAH and CRAC, chilled and condenser water pumps | BACnet, native or via comm card; VFDs over BACnet or Modbus | Read only |
| Liquid cooling | CDUs and coolant loops | Redfish REST over JSON (DMTF DSP2064); Modbus or SNMP on older units | Read only |
| Data center power | UPS, PDU, switchgear, generators | SNMP via DCIM, Modbus via EPMS | Read only |
| Maintenance history | CMMS and EAM records, including free-text work orders | Flat export, or API where available | Read only |
| Dispatch | CMMS and EAM, dispatch queue, SMS and voice gateway, email and chat | API, webhook, or the channel you already use | Write, to your workflow, never to your plant |
Where BRICK tagging or ASHRAE Guideline 36 point naming is already in place, calibration is faster. Neither is a prerequisite. A chiller on a current controller typically exposes fifty to sixty usable points; a site with sixty CRAHs is a better fit than a site with one chiller.
That is not a policy we adopted. It is how the product is built, which is a different and more durable thing.
PRISM cannot change a setpoint, close a valve or start a machine. Not because it is disabled, but because the capability is not built. Ingest is one-directional from your historian or API, under a read-only credential. No agent, no controller and no gateway is installed on your network.
Six to twelve months of history as flat files under NDA. No connection to your environment, no credential issued, no firewall change, no vendor onboarding queue. If your security team never has to open a ticket, that is the design working.
We will state our current SOC 2 and ISO 27001 position directly and in writing at the scoping call, specific about what is in place and what is in progress. The honest answer belongs in a document you can hold us to, not a badge on a web page.
Covering the data path, storage, encryption in transit and at rest, retention, and the no-write guarantee. Available before you commit to anything, and written for your security reviewer rather than your procurement team.
No to both. Mixed, gapped and inconsistent telemetry is the expected input, and the models were developed specifically against data of that character. Where work-order history exists we parse it ourselves, free text included. Where it does not, we surface anomalous periods for a short human review to label, and bootstrap from there. On a new build with no history at all, commissioning is a natural starting point, because the healthy signature can be established as normal is being established.
No, and it is not a configuration option. There is no write path to plant controls in the product. Ingest is one-directional from your historian or API, with no agent, controller or gateway installed on your network. The only thing PRISM writes to is your workflow: a work order, a text message, a call, a webhook.
Threshold and anomaly tools fire on a single channel crossing a line, which by definition happens once the failure is underway. They also stay tied to the hardware they shipped with. PRISM models the joint signature across correlated channels and catches the drift before any threshold is reached. It names the probable failure mode, quantifies the time you have, and stays vendor-neutral across a mixed fleet. It also reduces the alert volume rather than adding to it, because every flag is triaged before a person sees it.
That is the failure mode we designed against. There is a console if you want one, but it is not where the product does its work. The daily ranked list arrives in the channel your team already reads, and individual predictions become work orders in the system your crews already open. If PRISM is doing its job, most of your people never have to learn a new tool.
Because the engine learns signatures rather than one asset type. A great many industrial assets are ultimately an electric motor driving a pump or a fan, and those generalize across scale. A fan in a server and a fan in a treatment plant are the same device at different sizes, and the model does not care about the size. The work in a new sector is tuning against that sector's failure modes and cost of intervention, which is what the evaluation is for.
Four to eight weeks, at no cost, and in the data center case with no live connection at all. One call of about forty-five minutes to scope the export and agree the asset list. You send six to twelve months of history as flat files under NDA. We calibrate, run a retrospective against failures you already remember, and score it, with misses counted as loudly as hits. Then you decide. If the retrospective finds nothing, you have learned that your plant is behaving, which is also a useful result.
We build a model on your telemetry, then review the predictions against your real failure history. You decide after you have seen it work.
1. NFPA 70B, Standard for Electrical Equipment Maintenance. The document became a standard with mandatory language in its 2023 edition. The 2026 edition adds §9.1.1.3, which permits the potential-failure to functional-failure (P-F) curve method to be used in determining maximum maintenance intervals; expands scope to cover predictive maintenance; and permits permanently installed thermal monitoring in place of field infrared thermography for several equipment classes. Section text is drawn from NFPA's published committee record rather than the issued edition, and should be verified against the purchased standard before being quoted.
Interval criteria. SAE JA1011 requires an on-condition task interval shorter than the shortest probable P-F interval. IEC 60300-3-11 defines the P-F interval and covers condition monitoring in task selection.
Figures. Failure development windows are industry-reported estimates rather than measurements. Adoption rates for condition-based and predictive maintenance are from published industry survey data, 2025. Performance figures are measured on Firstlook production water deployments and are labeled by evidence tier on the proof page.