PRISM learns the normal operating signature of anything that flows: water, coolant, current. It catches the drift toward failure months before a threshold trips, names the likely fault, tells you how long you have, and puts the job in front of the person who can do it.
Threshold alarms fire at the red line, once the failure is already underway. PRISM watches the shape of the deviation instead. Across 28 consecutive failures at a live deployment, it flagged 26 of them a median of 150 or more days early.
Nine months of production operation at a top-10 US water operator, plus data center cooling and power. No sensors installed, no site visits.
A pump does not fail on the day it stops. It degrades for months, and every one of those months is written into the telemetry you already collect. Your alarms are set to fire at the end of that story.
A threshold trips once the failure is already underway. By then the choice is an emergency call-out at a multiple of the planned cost, not a scheduled repair at next outage.
Sites routinely carry hundreds of standing nuisance alarms. Crews have learned to filter them out, which means the one that mattered gets filtered out too.
Replacement runs on age and informal judgment. A quietly failing station waits its turn behind one that still has years in it.
Every predictive tool you have been pitched asks for one of two things: a box on your equipment, or a login your team will not use. Firstlook asks for neither. It reads what you already collect, and delivers into the workflow you already run.
One-directional ingest in, decisions out. Nothing in the product can change a setpoint, close a valve or start a machine.
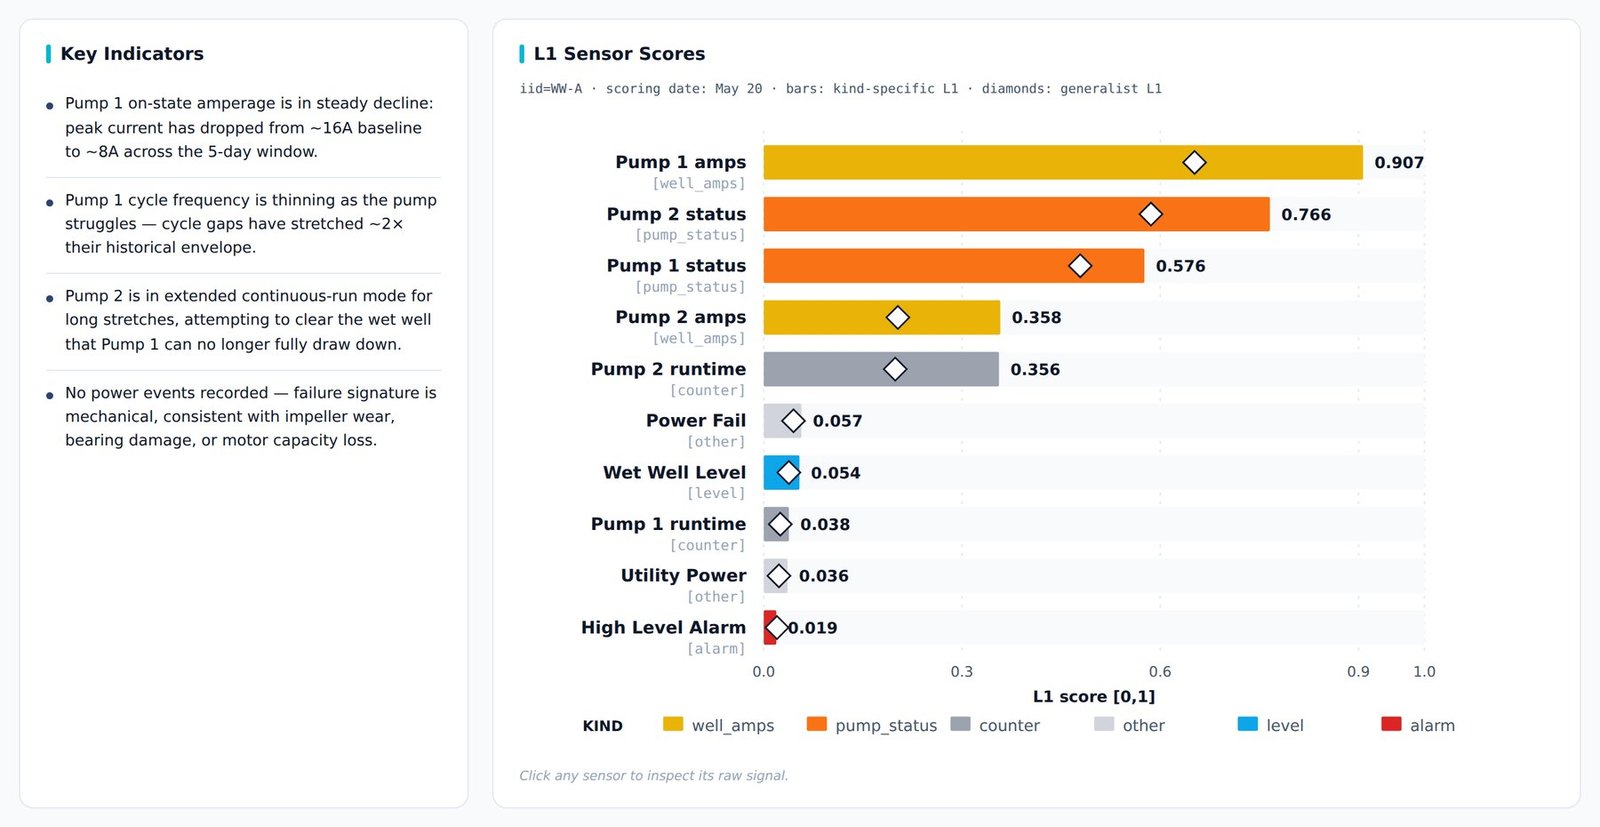
Not a health score. The probable fault, read from the shape of the deviation, in the language a maintenance planner already uses.
A date and a confidence band, not a percentage. 94 days, window 78 to 112. That is something you can schedule against.
The recommended fix, the parts lead time, and what it costs if you defer. A decision, not a dashboard to interpret.
The work order lands in the system your crews already use, and the on-call tech gets a text. No new tool. No new login.
PRISM triages every flag before a person sees it and hands over a ranked list, tuned so a truck never rolls for a station that does not need work.
A remote station drops off the network for a week, then dumps a week of readings in two minutes. Most predictive tools cannot use that week at all. Ours was built for it.
The engine learns signatures rather than one asset type. A fan in a server and a fan in a treatment plant are the same device at different scale, and the model does not care about the scale.
PRISM reads the SCADA, BMS, EPMS and historian telemetry you already collect, and works with imperfect, heterogeneous data exactly as it exists.
One-directional, read-only pull from your historian or API. Mixed, gapped and mislabeled data is expected.
Multivariate signature modeling across correlated channels, per asset, before any threshold is reached.
Identify the probable failure mode from the shape of the deviation, and explain it in operator language.
Time to failure with a confidence band, ranked against everything else on the network.
Work order, text, call or webhook, straight into the system your team already runs.
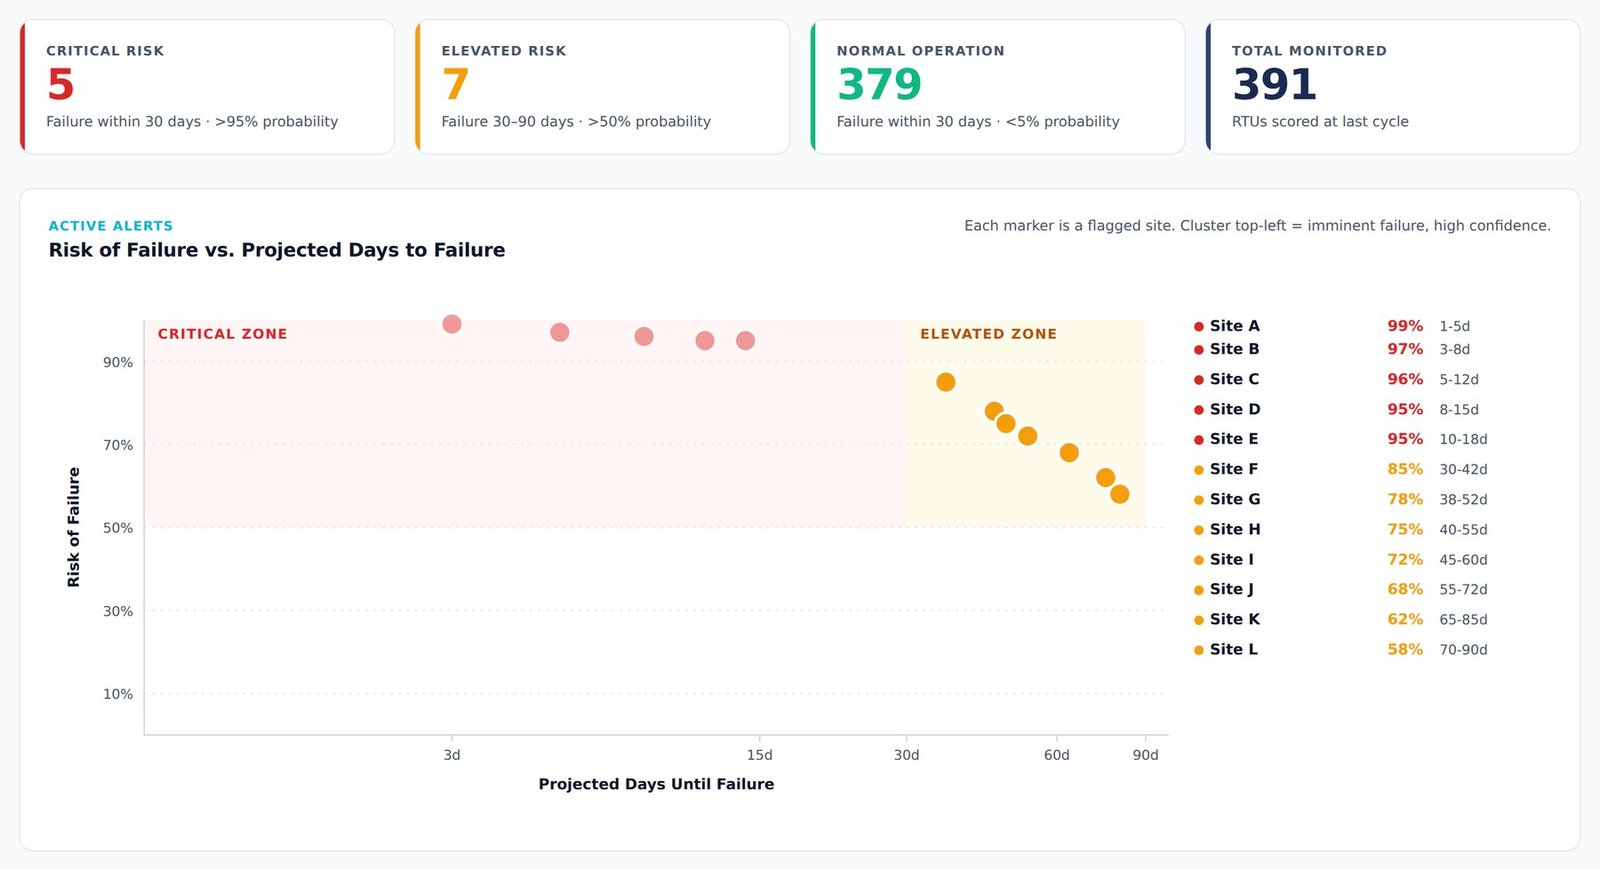
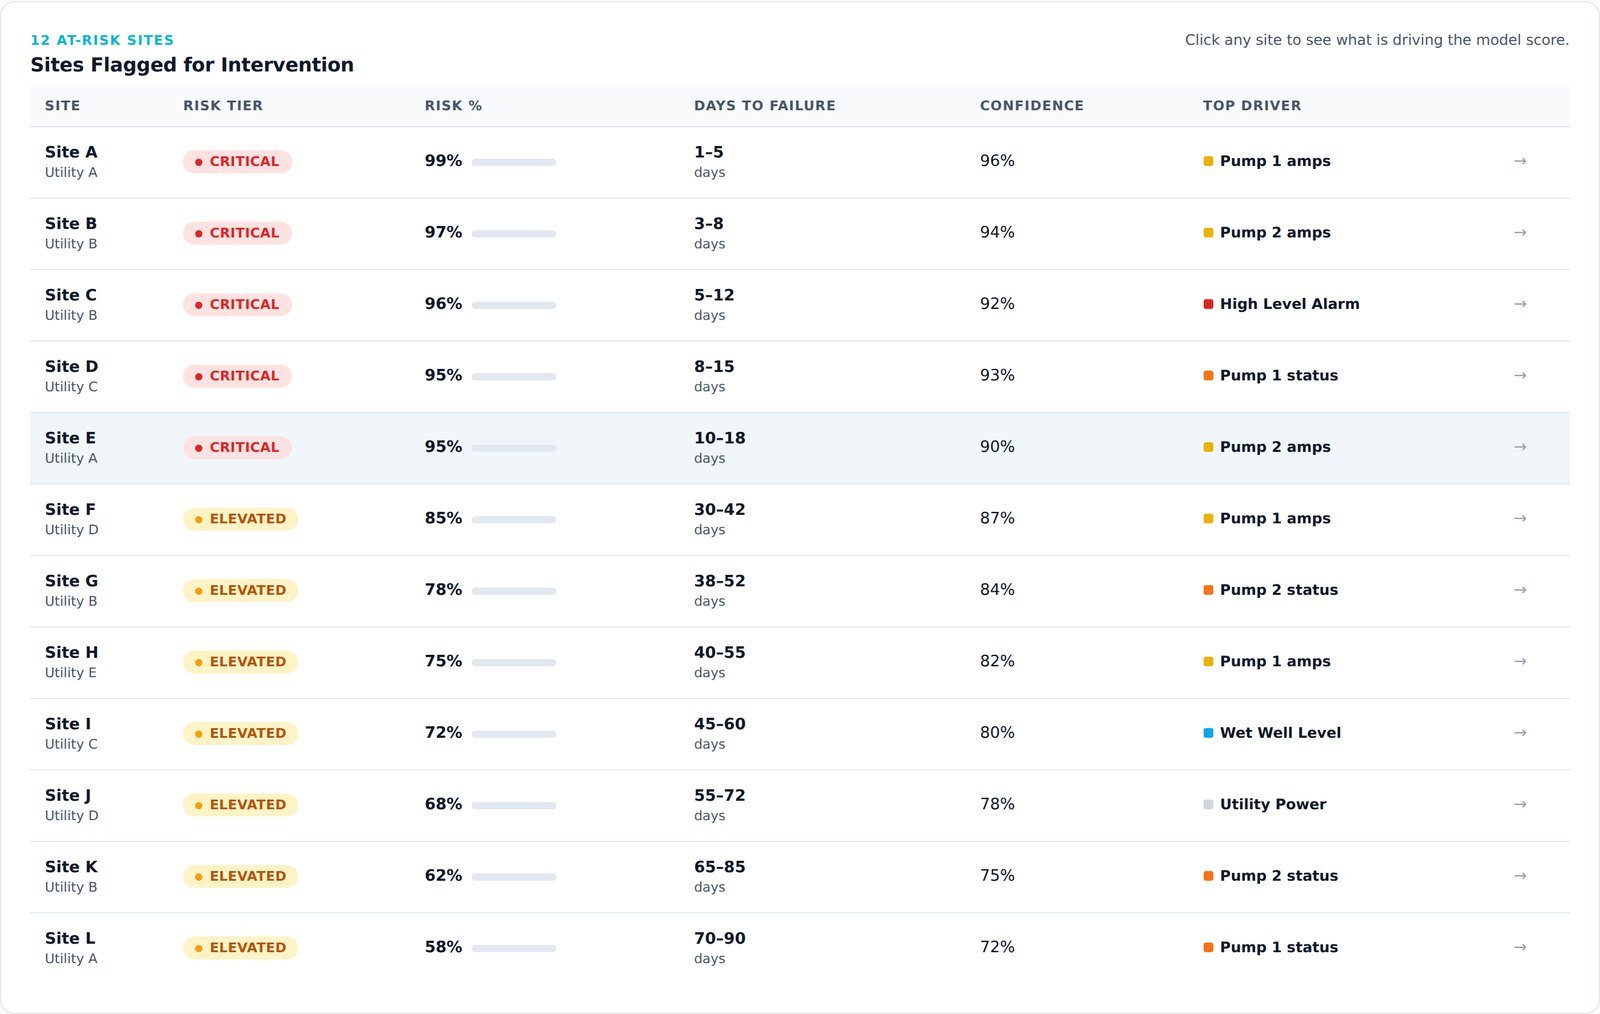
This is the view a maintenance planner opens. Not a health score to interpret, but every monitored asset laid out against the clock, so the work sorts itself.
Each bar is one asset's predicted days-to-failure window. Where it sits is when to act. How dark it is is how certain and how severe. Sorted soonest first, so a planner works top to bottom.
The physics of early warning does not depend on the medium. Every continuous flow carries a signature, and that signature shifts before the system fails.
Treatment works, wells, high-lift and booster pumps, lift stations and collection.
Chillers, cooling towers, CRAHs, CDUs and coolant loops. UPS strings, switchgear and distribution.
Midstream and pipeline pumping, mining dewatering and slurry, chemical and pharmaceutical process plant.
The reference deployment is expanding, the method is moving into two new sectors, and there is an OEM channel with an installed base already in the ground.
Production-ready for enterprise rollout across an installed base already in the field. It reaches assets that per-unit hardware economics will never justify monitoring.
5,000 installations, 40 statesA private-equity-backed operator running assets across eleven states. From the original 391-asset deployment to a nationwide rollout covering well monitoring and leak detection, still with zero field hardware installed.
11 states, expandingRegulated water companies, where failure costs show up in regulatory penalties and service commitments as well as repairs. That is where advance notice is worth the most.
Two regions in discussionWe are also in partnership discussions with a data center operations firm founded by former hyperscaler facility-operations leadership. Full reference list on request
Across 391 continuously monitored assets over nine months, PRISM returned 9.3× on spend, reconciled against the operator's own cost records. Almost none of it came from avoided outages. It came from asset-level failures caught before they escalated, which is exactly the category that redundancy hides and nobody counts.
Return on spend, measured against the operator's own cost records
Realized savings per monitored asset per year, earned where failures cost far less than in a data center
Consecutive failures flagged before they happened, over a 228-day window
Median advance notice, with 7 events still flagged at the edge of the window
See all 28 events, the intervention ledger, and the methodology
First-order projections anchored to the record above. The real number comes out of your telemetry during an evaluation.
Scaled from realized per-asset savings, with the intervention rate as the control that moves the answer.
Basis. $1,616 realized savings per monitored asset per year at an 83.6% intervention rate, scaled linearly. Event frequency from 28 failures across 391 assets in a 228-day window, annualized. System-class weighting is modeled. Excludes asset-life extension, capital deferral, energy and regulatory upside.
Downtime priced entirely on your own hourly number. Maintenance avoidance priced on ours.
Basis. Downtime exposure is entirely your input. Presets anchored to published survey bands: 91% of mid-size and large enterprises put an hour above $300K, 41% between $1M and $5M or more. Maintenance avoidance at $1,616 per monitored asset per year, carried unchanged from the water deployment as a conservative floor. Excludes secondary damage, expedited freight, capacity loss from equipment lead times, and insurance effects.3
“We treated the problem as an organism, not a machine. There are a thousand unknowns in why a kidney fails, and you still see it coming. A station full of sensors is no different. It has a homeostasis, and it loses it before it dies.”
Brody Holohan, PhDChief Technology Officer, Firstlook AIA short scoping call, a model calibrated to your assets in four to eight weeks, and a retrospective scored event by event against failures you already remember. You check us on incidents you lived through.
No cost to evaluate. No live connection required. No exclusivity, and no obligation.
1. Uptime Institute Global Data Center Survey 2025, on operator willingness to delegate tasks to AI.
2. Uptime Institute outage analysis, on cooling as a cause of significant outages, and published data center insurance claim frequency data.
3. Downtime cost bands are from published enterprise surveys and are presented as presets only. Every downtime figure on this site is the operator's own input. Warning rate and repair multiple are trade-source estimates. All Firstlook performance figures are measured on production water deployments and reconciled to the operator's cost records.